| III. Configure the setting of Alarm Analysis for some functions |
To display a trend graph |
To display sampled data (numerical values) |
To display operation log |
|
|
|
|
| (Click each text, and its setting procedure will appear.) |
| |
|
| [ Sampling Setting ] |
| 1. |
Click [Sampling] on the [Common Settings] menu and configure the setting for collecting data. |
|
| Reference: |
GP-Pro EX Reference Manual [Sampling] |
|
2.
|
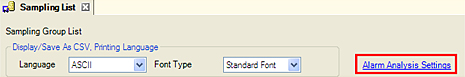
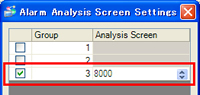
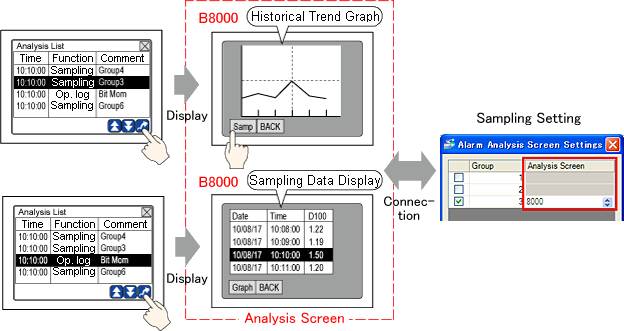
Click [Alarm Analysis Settings] and check the group number targeted for Alarm Analysis.
Also, specify the [Analysis Screen] number to be displayed at the time of an Alarm Analysis operation. |
| |
|
| |
|
| |
<Setting Example> Group Number [3], Analysis Screen Number [8000] |
| |
|
| |
 |
| |
 |
| |
|
| 3. |
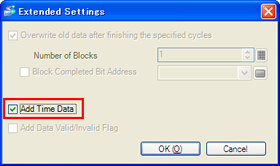
Select the [Mode] tab of Sampling and click [Extended Settings].
Make sure [Add Time Data] is checked. |
| |
 |
| |
| IMPORTANT |
The sampling group, for which an Analysis Screen number is not specified in the [Sample] setting on [Common Settings] or [Add Time Data] is not checked in [Extended Settings] of [Mode], is not displayed as an analysis target. |
|
|
| |
|
| 4. |
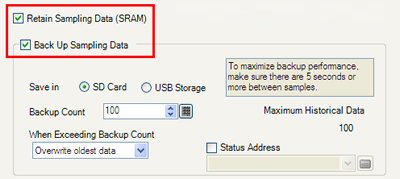
Make sure that [Retain Sampling Data (SRAM)] is checked on the [Mode] tab. |
| 5. |
Check [Back Up Sampling Data] on the [Mode] tab. |
| |
 |
| |
| NOTE |
When [Back Up Sampling Data] is checked, if you use the Alarm Analysis function only, you don’t need a SD card/a USB storage device.
Only when you back up the data saved in SRAM, you need a SD card/a USB storage device for the touch operator interface unit. (Data are saved in a binary format file.) |
|
|
| |
|
| |
The Sampling setting is now completed.
Go to the next for the data you’d like to display for Alarm Analysis.
To display a trend graph |
To display sampled data
(numerical values) |
|
|
|
| |
|
|
| [ Historical Trend Graph Parts Setting ] |
| 1. |
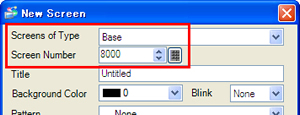
Create a base screen with the number specified for [Analysis Screen] in the step 2 of the Sampling Setting above. Click [New Screen] on the [Screen] menu and create a base screen.
(If you have already created a base screen, open the screen.)
|
| |
|
| |
|
| |
<Setting Example> Analysis Screen Number [8000] |
| |
|
| |
 |
| |
|
| 2. |
Click [Historical Trend Graph] on the [Parts] menu and place the Part on the base screen created in the step 1. |
| 3. |
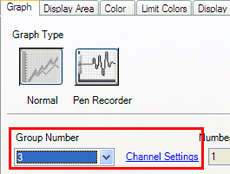
Double click the placed Historical Trend Graph. The setting dialog box appears.
Click the [Graph] tab and set the group number specified in the step 2 of the Sampling Setting above for [Group Number].
<Setting Example> Group Number [3] |
| |
|
| 4. |
Click [Channel Settings] and select an address for trend graph display. |
| |
 |
| |
|
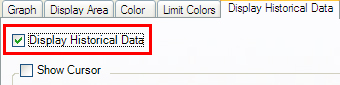
| 5. |
Click the [Display Historical Data] tab and check [Display Historical Data]. |
| |
 |
| |
|
| * Configure the other settings of the Historical Trend Graph Part as you like. |
|
| |
|
| 6. |
Click [OK] to confirm the setting. |
| |
|
|
| [ Sampling Data Display Parts Setting ] |
| 1. |
Create a base screen with the number specified for [Analysis Screen] in the step 2 of the Sampling Setting above.
|
| |
|
| |
|
| |
<Setting Example> Analysis Screen Number [8000] |
| |
|
| |
|
| |
|
| 2. |
Click [Sampling Data Display] on the [Parts] menu and place the Part on the base screen created in the step 1. |
| 3. |
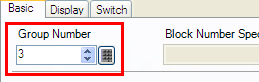
Double click the placed Sampling Data Display. The setting dialog box appears.
Click the [Basic] tab and set the group number specified in the step 2 of the Sampling Setting for [Group Number].
<Setting Example> Group Number [3] |
| |
|
| |
 |
| |
|
| * Configure the other settings of the Sampling Data Display Part as you like. |
|
| |
|
| 6. |
Click [OK] to confirm the setting. |
| |
|
|
| [ Operation Log Setting ] |
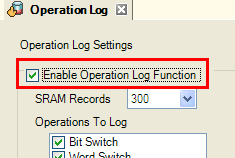
| 1. |
Click [Operation Log Settings] on the [Common Settings] menu and check [Enable Operation Log Function]. |
| |
 |
| |
|
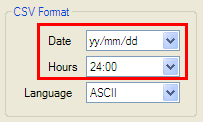
| 2. |
In the field of [CSV Format], select
Date: Except mm/dd
Hours: 24:00:00 |
| |
 |
| |
| IMPORTANT |
If the Date of [CSV Format] is set to [mm/dd], the data targeted for Analysis will not be displayed. And if the Hours of [CSV Format] is set to [12:00:00], it will be recognized as AM (before noon). |
|
|
| |
| * Configure the other settings of Operation Log if needed. |
|


 沪ICP备05028659号-3