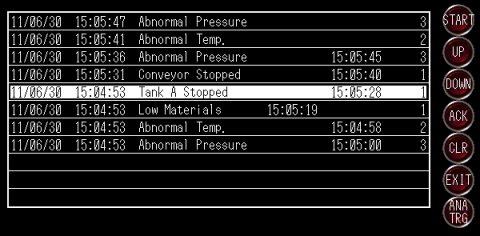
Select the alarm you want to analyze, and touch the [Analyze (Trigger Time)] switch.
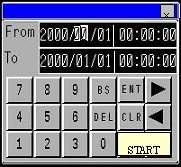
The Search Condition Entry keypad appears. The [To] field is populated with the trigger date/time of the alarm you selected, and the [From] field is populated with the date/time one day earlier than the date/time in the [To] field. Adjust the time as necessary.
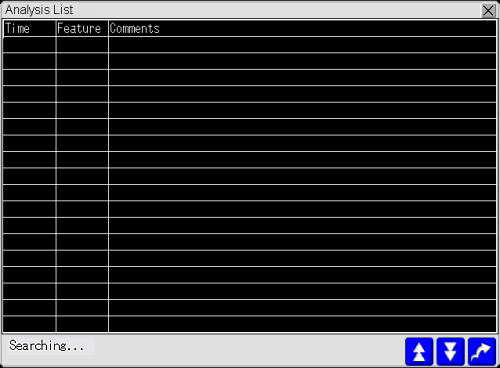
Touch [START]. The search process starts, and the Analysis List screen opens with the text "Searching…" blinking. The bit 0 of the system variable "#H_AlarmSyncStatus" (Alarm Analysis State) turns ON.
![]()
It may take up to a few minutes to complete the search. See the following for more details about the search process:
 20.11.3 About Alarm Analysis
If you select [None] for [Blink] in [Display Color] from the [System Settings], [Display Unit] link, the text, "Searching…", does not blink.
 5.4.2.2 Display Unit [Display] - Display Settings
If the Operation Log is saved to a CSV file during search, the search is stopped, and the bit 8 of the system variable "#H_AlarmSyncStatus" turns ON.
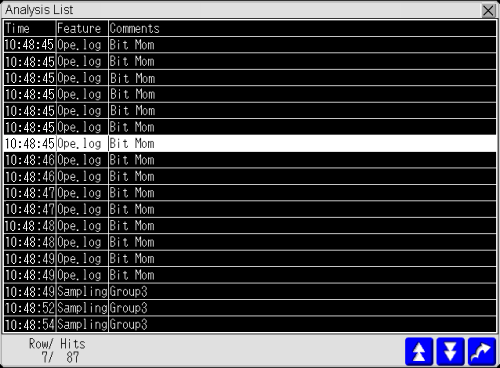
Once the search is complete, the Analysis List displays the operation log records and/or sampling group records retrieved from the display unit's internal memory or external storage.
|
|
Closes the Analysis List screen and goes back to the previous screen. It also clears the Alarm Analysis State. |
|
|
Scrolls up the Analysis List by one page. |
|
|
Scrolls down the Analysis List by one page. |
|
|
Opens the Alarm Analysis screen for operation log, if you have selected a row from operation log. Opens the Alarm Analysis screen for sampling group, if you have selected a row from a sampling group. |
|
Cursor No./Hit Count |
Displays the row number for the currently selected row and the number of data records that matched with the analysis conditions. |
![]()
The [Comment] column in the Analysis List displays the [Action] information for operation log or the [Comment] specified for the sampling group.
Please see the following for information about operation log [Action]: 23.14.1 Operations To Log
The Analysis List displays up to 500 search results.
As the Analysis List screen is configured by the system, you cannot change its font size, switch shapes, or labels.
Let's look at an operation log record.
From the Analysis List, select an operation log record you want to examine from the Analysis List, and touch ![]() . The Alarm Analysis screen for operation log appears.
. The Alarm Analysis screen for operation log appears.
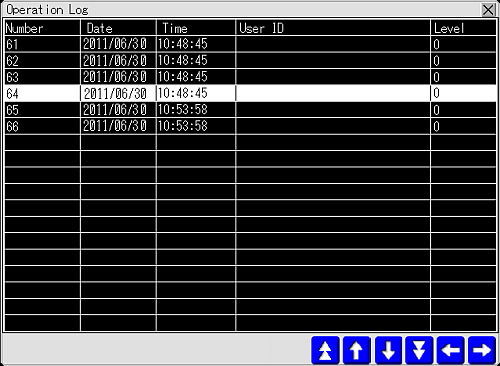
|
|
Returns to the Analysis List screen. |
|
|
Scrolls up the operation log list by one page. |
|
|
Scrolls up and down. |
|
|
Scrolls down the operation log list by one page. |
|
|
Scrolls right and left. |
![]()
To identify the operator, you need to enable [Add User ID]. To access this feature, from [Common Settings] menu, point to [Security] and click [Security Password] to open [Set Password] dialog box. Select [Enable Security Function] and [Add User ID].
Please see the following to find out more about the Alarm Analysis screen for operation log:
 23.14.2 Operation Log Contents, Example Output
As the Alarm Analysis screen for operation log is configured by the system, you cannot change its font size, switch shapes, or labels.
The Alarm Analysis screen can display up to 500 matching operation log records, including the records that are not included in the Analysis List.
Touch ![]() to go back to the Analysis List screen.
to go back to the Analysis List screen.
Next, let's look at a sampled data record.
Select a sampling group you want to examine from the Analysis List, and touch ![]() . The Alarm Analysis screen specified for the sampling group appears.
. The Alarm Analysis screen specified for the sampling group appears.
Change to a different screen.
You can maintain the Alarm Analysis State if you select [Save alarm analysis information] when you touch a Change Screen switch.
Touch a Change Screen switch with the [Previous Screen] specified to go back to the Analysis List screen.
If you touch ![]() in the Analysis List screen, the Alarm Analysis State is cleared and the screen with the alarm part appears again.
in the Analysis List screen, the Alarm Analysis State is cleared and the screen with the alarm part appears again.